


As your organization looks to prioritize cybersecurity, it is important that you have a method in place for actively monitoring your network and searching for network traffic anomalies. Identifying these anomalies is important for a number of reasons, primarily that they can indicate when:
So, whether past, present, or future, network traffic anomalies are important, and they deserve to be managed appropriately. In fact, US Department of Defense contractors are required to actively monitor their inbound, outbound, and internal network traffic for anomalies. The National Institutes of Standards and Technology (NIST) 800-171 cybersecurity standard has four safeguards that are related to network traffic monitoring:
Network traffic anomalies come in lots of flavors, but a few examples are:
You might choose to partner with a third-party Managed Security Service Provider (MSSP), who would take on the network traffic analysis (NTA) responsibility for you and alert you when things go wrong. MSSPs essentially run a Security Operations Center (SOC) staffed with trained security analysts who know how to make sense of all the information captured by a sensor they install in your IT system to monitor traffic. Easy peasy. MSSPs have their preferred NTA tools they use to collect, manage, and analyze network traffic.
Or, if you would prefer to save money and hunt for anomalies yourself, there are options for this, too. We have already discussed one way that you can accomplish this using LogRhythm’s Netmon Freemium. In this blog, we will present a general overview of how to conduct network traffic analysis with Security Onion, a free Linux-based NTA used for threat hunting, network security monitoring, and log management.
One quick note before you continue reading: in order to enable Security Onion to monitor your network, you will need to setup either port mirroring or a basic network tap that will feed your network traffic into Security Onion.
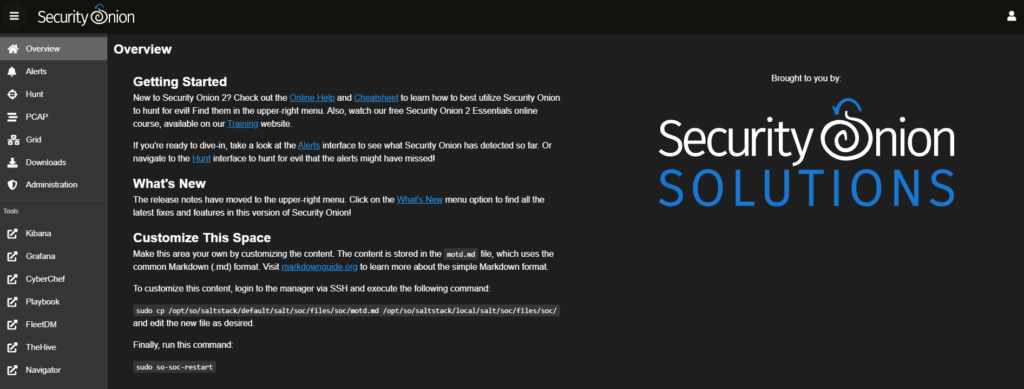
Once you’ve installed and configured Security Onion, you will gain access to the Security Onion Console (SOC). This is the primary user interface through which all NTA management will take place, so everything that we outline in this blog will be occurring inside this tool.
Upon opening the SOC, you’ll notice a number of menu items on the left-hand side. The upper section includes the tools which are native to Security Onion: Alerts, Hunt, PCAP, and Grid. Found in the lower section are other third-party tools which are integrated into Security Onion: Kibana, Grafana, CyberChef, Playbook, FleetDM, TheHive, and Navigator. We will not be using all of these tools during this example, but they each could come in handy when monitoring your network.
The Alerts tab allows you to sort, acknowledge, or escalate alerts should you choose to do so. Note that Security Onion characterizes alerts in terms of severity in the following order:
Now that we know our network is generating alerts, the next step would be to identify which alerts are indeed true positives. Just because an alert isn’t labeled as ‘Critical’ doesn’t mean it isn’t indicative of an issue. We’ll need to do some more digging, but since the Alert tab doesn’t provide much information other than what you see here, we’ll use Security Onion’s external tools to dig a little deeper.
To begin the process of in-depth network traffic analysis, we’ll start with Kibana. Kibana is a data visualization tool which allows you to analyze data generated by Elasticsearch.
As you can see, network traffic adds up quickly! Thank goodness we don’t have to flip through every single one of those individually. If you look closely, you’ll notice that Security Onion breaks down each log and assigns it to a particular dataset. Although we’re most concerned with the alerts dataset here, you do have the option to look through any of these categories and conduct further network traffic analysis.
Because this demonstration is taking place inside a virtual environment, and the host is only monitoring itself, there isn’t much in the way of alerts that we should expect to appear. If this were implemented inside an actual diverse network, the results would be far more robust. Given this, I am going to “attack” the Security Onion host from another virtual host, and we will see what pops up in the console.
A successful brute force attack against the Security Onion host instantly generated a handful of alerts:
The two alerts that should immediately concern us are:
sshd: Attempt to login using a non-existent user.
sshd: authentication success.
Not only did the adversary attempt an SSH brute force attack, but they were also successful. A closer look at these alerts reveals to us the culprit responsible for the attack:
Keep in mind that Security Onion will monitor whatever interfaces you tell it to monitor. In this case, since it is currently only monitoring itself, the only network traffic that appears in the SOC will be its own. An attacker does NOT have to attack the Security Onion host directly for an alert to appear inside the SOC. So long as you properly configure Security Onion to monitor your entire network, it will capture the event, even if it is between two separate hosts.
One of the biggest challenges you will face while monitoring your network will be differentiating true positives from false positives. Security Onion throws a lot of information at you, so it is imperative that you have an understanding of networking, network security, and log management before you attempt to identify true positives. Additionally, it is crucial that your organization have a risk assessment methodology identified and in place before you decide what to do with an alert.
Once you have identified a true positive, it is time to take action. Depending on the structure of your organization’s information security department, you may need to escalate the alert to another security analyst. Security Onion has integrated into its console TheHive, an incident response platform. We will now escalate this issue to TheHive to document that an incident has occurred, and that action must be taken.
Once escalated to TheHive, you can begin to add tasks, observables, and other information pertinent to the incident. This will come in handy if you have multiple members on your team who need to access this information quickly. In the case of this incident, I would create an observable that looks something like the following:
Once your observables are documented, you can begin to discern the next steps. We recommend that this closely follow your organization’s Incident Response Plan (IRP). In our case, we’ve already detected and analyzed the incident, so now it is time to contain, eradicate, and recover. We’ll use the Tasks feature in TheHive to designate these responsibilities to our team members and prevent this incident from occurring again.
Upon working our way through our IRP and resolving the issue, we can close the ticket in TheHive.
Actively monitoring your network is a crucial component of an effective cybersecurity plan. We have presented to you Security Onion, a free Linux distro that you can consider using to accomplish this. Through this analysis, we have demonstrated how Security Onion can be used to identify, analyze, escalate, document, and close alerts. Even if Security Onion is not the answer, we would strongly encourage your organization to find a solution for actively monitoring your network. If you are still uncertain what this should look like, contact us!
Good luck out there!
–Nathan Cross, Cybersecurity Engineer
Like this post? Share it!